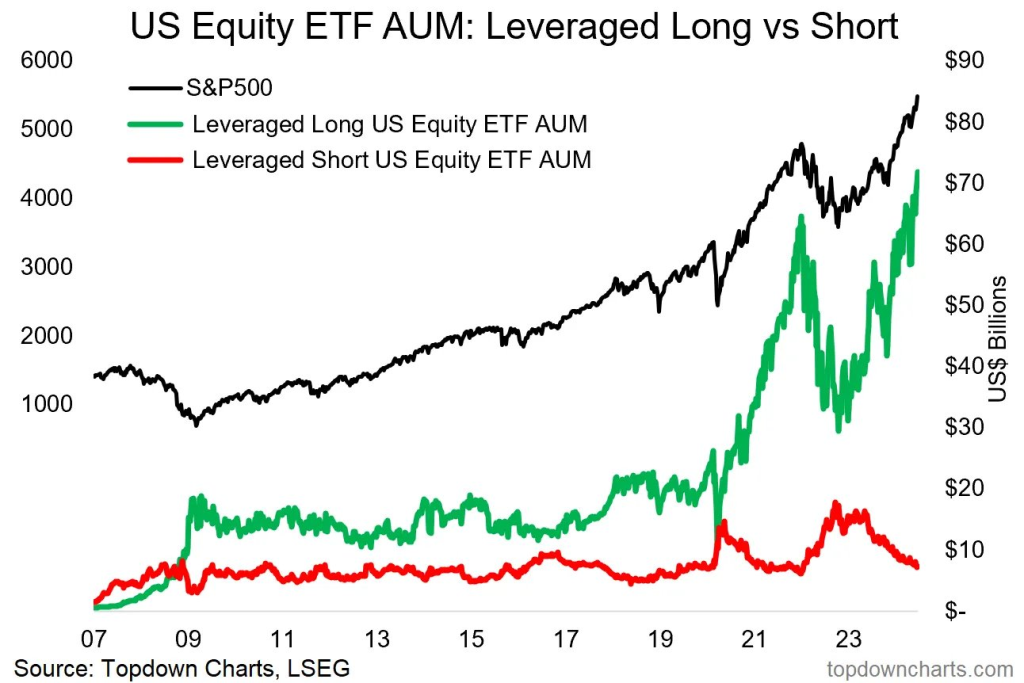
Since 2020, a trend has emerged in in retail investing: the long-term holding of leveraged ETFs, as opposed to their traditional use in day trading. This shift is illustrated by this chart from Topdowncharts.com shared on X. While conventional wisdom often advises against this practice, a growing number of investors appear to be disregarding such warnings.
Nothing in this article constitutes financial advice and I am not a financial advisor, nor is Shinoji Research a financial advisory organization. These are my personal opinions on the subject.
Backtesting Leveraged ETFs
Estimating the returns of leveraged ETFs before their actual introduction presents challenges, primarily due to tracking errors that significantly impact long-term performance. To address this, I employed a support vector regression (SVR) model trained on SPXL (a 3x leveraged S&P 500 ETF) returns against SPX (S&P 500 index) data.
The model’s output appears generally plausible, with one notable exception: the 1987 stock market crash. This event, representing the most severe single-day market decline in history, falls outside the model’s training data range. SVMs typically struggle to accurately predict such extreme outliers.
For the 1987 crash, I opted to use a simple 3x multiple of the daily return. However, it’s worth noting that in reality, the impact could have been more severe due to factors such as margin requirements (additional reading: The XIV Disaster).
The Results
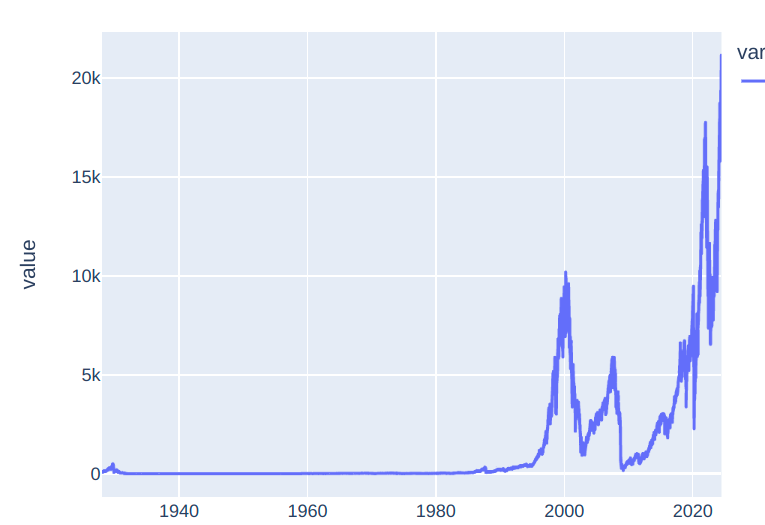
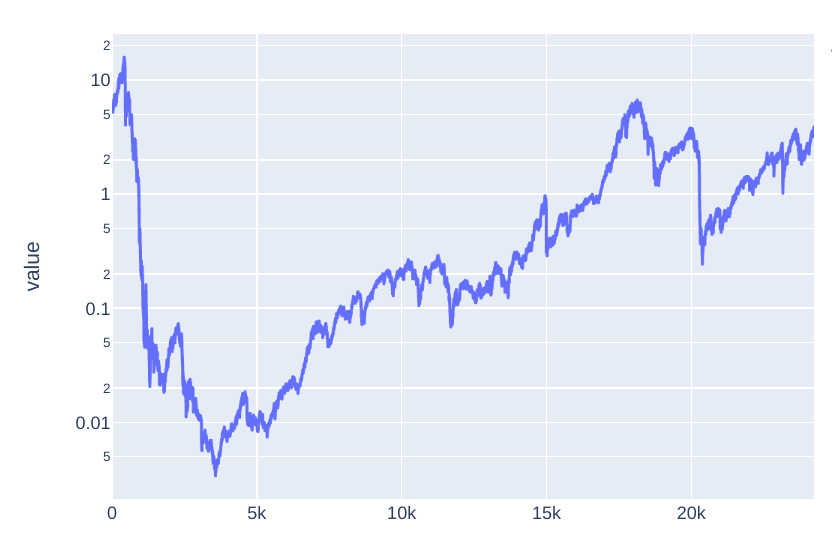
The magnitude of volatility in these results is striking. It’s noteworthy that SPXL was introduced at an opportune moment in market history, near the bottom of the Global Financial Crisis (GFC). Had it launched just a few months earlier, we would likely see a massive drawdown in its initial performance.
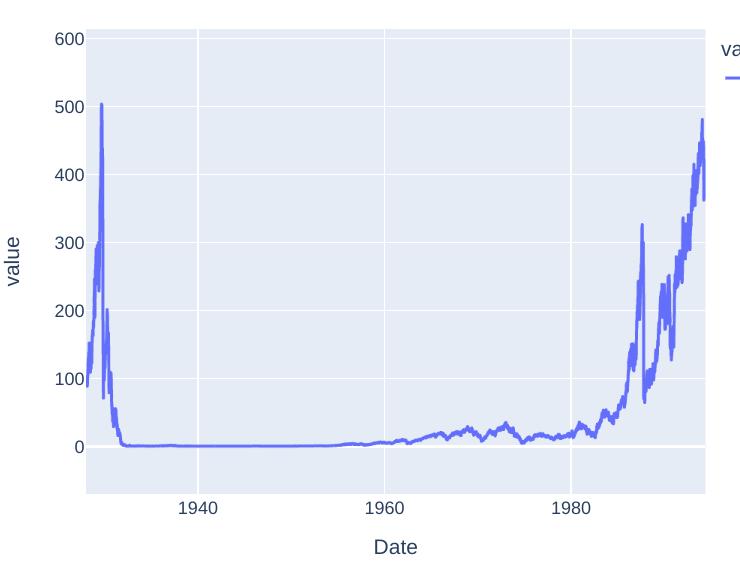
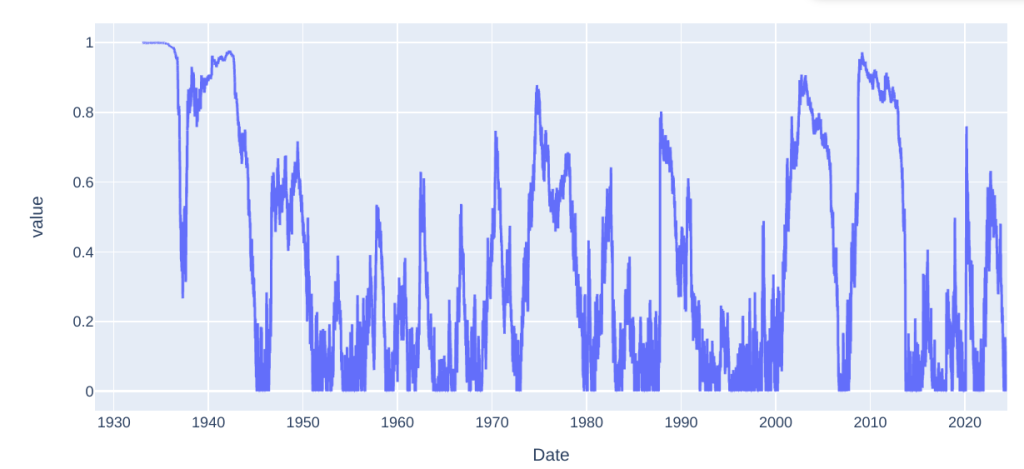
Examining the period between 1929 and 1994 reveals interesting insights. Surprisingly, the leveraged strategy performed relatively well during the stagflationary period of the 1960s-1980s, despite the choppy market conditions typically unfavorable for leveraged instruments.
Here’s a zoomed version showing the period between 1929 and 1994. It did surprisingly well during the stagflation chopfest of the 1960s-1980s,

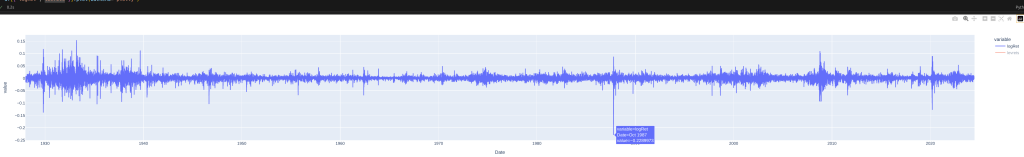
The logarithmic chart, indexing returns to 100 starting from February 1928, offers another perspective on relative performance:
- From 1940 to 2000: Despite significant drawdowns mid-period, the leveraged ETFs would have outperformed the index.
- From 1928 to 1940 and 2000 to present: The index outperformed the leveraged strategy.
This performance dichotomy highlights the time-dependent nature of leveraged ETF returns and the importance of entry points in long-term performance.
This chart depicts the ratio of the SPXL ETF (3x leveraged S&P 500 ETF) to the S&P 500 stock index. While similar to previous charts, it offers a crucial insight into relative performance. Notably, an investor who hypothetically purchased the leveraged ETF in 1929 would still be underperforming the index, even after 80 years. This stark illustration underscores the long-term impact of leveraged ETFs’ structural characteristics, particularly the effects of volatility decay and compounding on extended time horizons
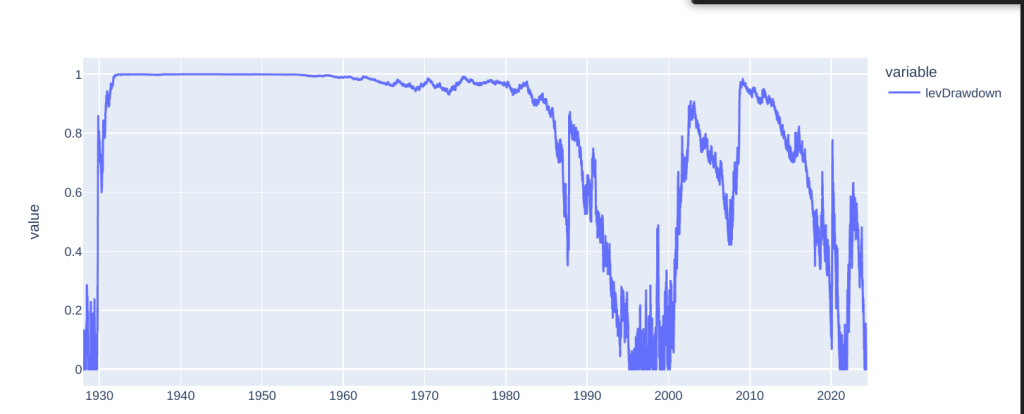
The chart illustrates the extraordinary volatility inherent in this leveraged strategy. Most notably, it shows a staggering 99.93% maximum drawdown, accompanied by multiple instances of 90%+ drawdowns. To provide additional context during the extended 60-year drawdown period, I’ve incorporated a 10-year rolling drawdown metric. This overlay helps visualize the magnitude and duration of underperformance relative to the peak value over each decade-long window.
Conclusion
Leveraged ETFs share similarities with strategies that risk above the Kelly criterion in trading. While they might serve as potential accelerants early in one’s saving phase, they are ill-suited for passive or long-term portfolios.
Key observations:
- Even disregarding the Great Depression, leveraged ETFs frequently experience extended periods of underperformance, often lasting two decades or more.
- These instruments may have utility within specific market timing systems but are inappropriate for passive investment strategies.
- Caution is strongly advised against ‘leveraged smart beta’ portfolios, such as the pre-2022 popular combination of leveraged long treasury bonds with leveraged S&P 500 ETFs. Historical correlations can prove far less robust than they appear.
- The 2022 market downturn illustrated a critical weakness in such strategies: While long bonds have historically hedged recessionary bear markets effectively, they failed to do so in a scenario driven by monetary tightening to combat inflation. This resulted in:
- SPXL (3x leveraged S&P 500) declining by 60%, with partial recovery but still underperforming relatively.
- TMF (3x leveraged long-term Treasury bonds) plummeting 90% and remaining near lows.
- The underperformance of bonds during the bear market led to the unintended consequence of selling stock ETFs to buy more of the underperforming bond ETFs, further exacerbating poor overall performance.
In summary, while leveraged ETFs may have specific applications for sophisticated investors in particular market conditions, they carry substantial risks and are generally unsuitable for long-term, passive investment strategies.
Leave a Reply