Recently I noticed, FTX.com upgraded their equity curve functionality to go all the way back to September 2020, coincidentally around the time I started using the kelly criterion. I posted the chart on twitter and many people said they were interested in learning about the formula behind it.
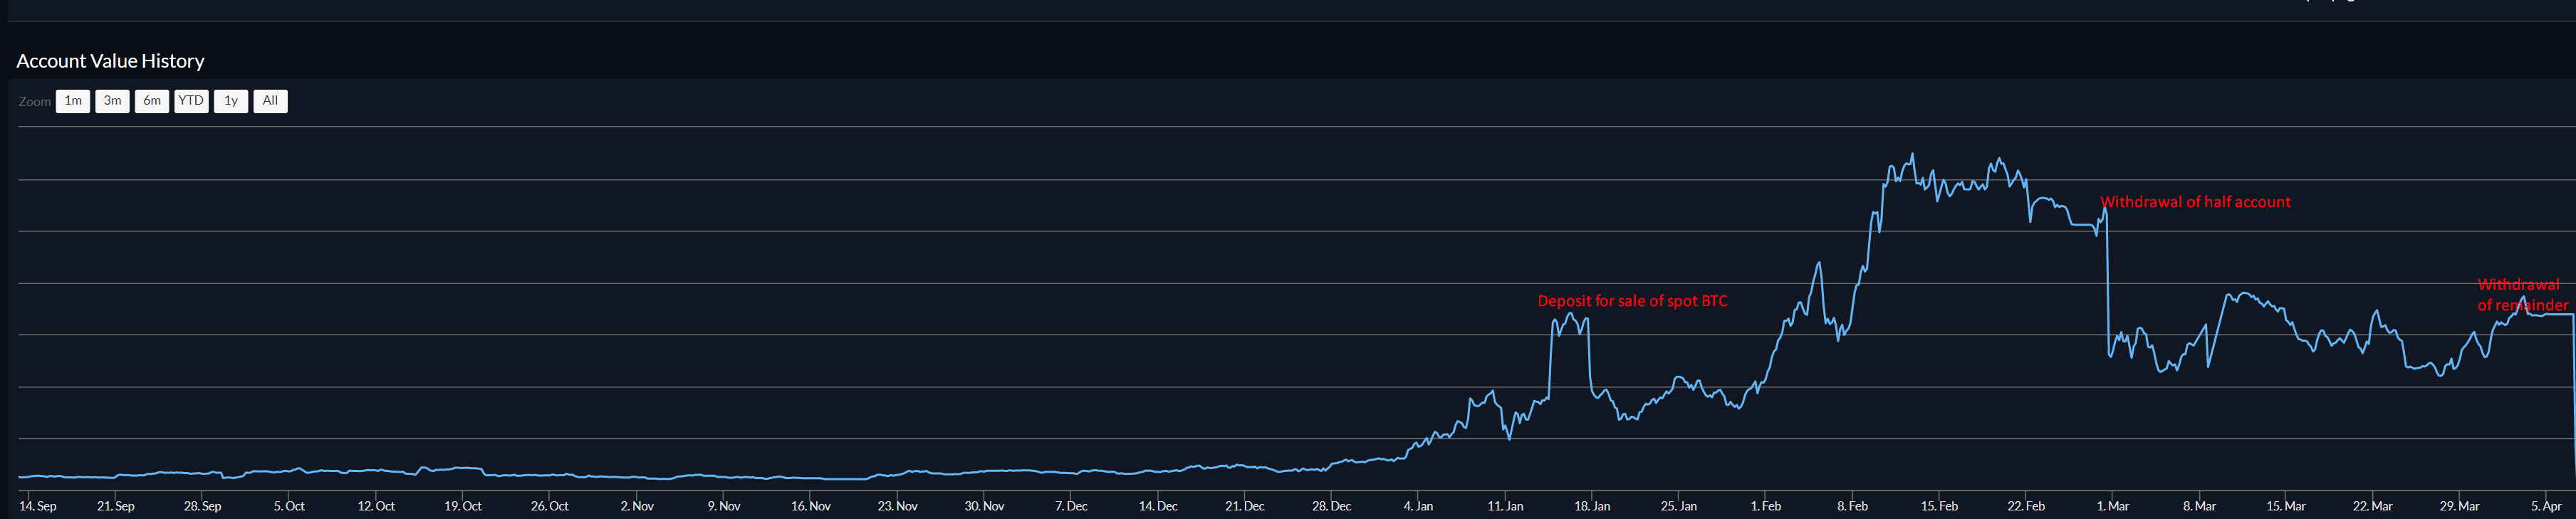
(Pic related), showcases the rapid run up, along with choppy periods. The big drops are labeled as withdrawals. There was also one big spike and drop (a friend calls it a crown), that was from a deposit and withdrawal (to fiat) of spot coins.
I’m not going to breakdown the trading / investment strategy in this article, as it varies tremendously depending on market conditions, and there are many paths to enlightenment. What I am going to cover in this article is position sizing and trade management, the secret to breathtaking returns (and avoiding ruin).

The “1%” or x% rule
If you have any interest in trading at all, you’ve likely heard of the so called 1% rule, or sometimes 2 or 4, or any other arbitrary percent. Many trading educators present a fixed number as gospel, usually with little to no statistical experimentation or explanation for their “Magic Number”.
As many others did, I initially started out with the 1% rule, but quickly realized it was extremely conservative for my needs (if I had stuck to the 1% rule, my returns for the period above would have been less than 100%).
I decided for no particular reason to up my allowable risk to 3%, truly degenerate compared to my previous 1% safety net. I stuck with this for a few months, and performance was good, drawdowns small, I was reasonably happy.
To end the x% rule era, I decided 4 or 5 months into the 3% rule era that as I was making less mistakes, I could up risk to 4%. Performance further improved, I stuck to this for several months, marking a period of stagnation, a peak on the dunning kruger chart.

The Road to Enlightenment
Around June 2020, I became fascinated with equity curve charts, and at this point FTX did not have a built in function, so I would export my daily PNL to a CSV file and then build a spreadsheet. I have always found charts interesting and built an equity curve spreadsheet, which survives to this day.
I started (probably out of autistic obsession) to experiment with many different formulas and charts, one of which pictures below would plot returns on a 90 day rolling basis of current equity (orange) and of starting equity (blue).

Around this time I devised a rough formula that would convert daily $ pnl to R’s (essentially % of equity / % risked, which was fixed at this point in history). Armed with this, I was suddenly able to experiment with what my PNL would have looked like, had I risked more or less (this formula over compounds, but is otherwise reasonably accurate).

I was approaching the limits of what could easily be achieved with spreadsheets, and out of interest I was starting to learn Python Programming. Python opened up a new world, with even my limited understanding I was now able to easily simulate any combination of risk to reward, probability and % risk I desired.
To my shock, assuming 3:1r 33% probability (the minimum I would take), the optimal risk was far higher than I was expecting, 7% dramatically outperformed 4%, and 10.6666667% was actually optimal (albeit with 90% drawdowns).
Fortunes Formula

After roughly experimenting with various %’s, I stumbled upon the kelly criterion, and the book “Fortune’s Formula“, an algebraic solution to the quest. A formula devised in the 1950s by two Bell Labs scientists, originally for rigged horse races with the potential for communication error.
The raw formula is as follows %risk = probability of win - (probability of loss / R:R ratio) (due to order of operations parenthesis are not actually needed, but I added for the readers clarity). This is the basic formula, and implementing this on it’s own would almost certainly result in ruin, especially if you have concurrent correlated trades.


The pink line on the full kelly simulation is something I doubt many people could stomach. A 3x return and 70% drawdown followed by hundreds of trades worth of chop. The half kelly scenario is still aggressive, but we see a lot less volatility. Returns are on average smaller, but much more peaceful.
I decided half kelly was a decent compromise for my risk appetite (I strongly recommend you run your own monte carlo simulation’s and decide for yourself what you can tolerate), but quickly ran into another problem, correlation risk.
Correlation Risk
Suppose you tend to run more than one trade at the same time, especially in crypto where correlation is EXTREMELY high. A dump in Bitcoin will drag every coin down, at least temporarily, running the risk of a flush knocking out several positions at once.
Our kelly formula assumes that every bet is independent, and that each position is sized based on equity after the previous was resolved. In the real world, if you run more than one position simultaneously, this is impossible. Running two full kelly positions puts your total risk at 2 kelly, which in the long run is near guaranteed to lead to ruin.

Combined with slippage risk and 1 kelly could easily frequently result in 3-4 kelly black swan events (with 3r 33% prob this is a 40% loss OVERNIGHT). To combat the aforementioned risks I use a combination of fractional kelly (downsizing from 1 to 0.5 Kelly’s), and then further impose a fraction based on the number of positions. Suppose you cap at 2 open positions, you divide your fraction by 2, resulting in 0.25 Kellys, a black swan risk of only 10% of equity, and we’re golden.
You might think that 2 separate positions are inherently less risky than 1 concentrated position, instead you could reduce your fraction by 2/3 of open positions. Now the black swan risk is instead 1.5 Kelly or 15% with our example, higher but manageable as both positions getting slipped hard will be a rare occurrence.
Stop order != Maximum Position Risk
The biggest danger with most retail trader risk management systems is that the perceived risk and actual risk can vary greatly. I might write an entire post on this subject, as most people I see on twitter still seem to be deluded into thinking their stop order is the most they can lose.
The stop loss is the minimum amount you should expect to lose, if the position goes south. I recommend reviewing your trading history to compare actual fills to your stops, and adjust position sizing accordingly. Calculate your loss % based on expected fill price rather than order price.
If you are trading stocks, forex or futures, you should not purely rely on a stop loss PERIOD. This is because of gap risk (for a terrifying leveraged example SNBOMB), the market can open higher than it closed, leaving your stops filled at an extremely unfavorable price, the kelly formula should not be blindly applied based on a stop loss in these situations.
A few options for mitigating this:
- Consider a put or call option, or an option spread risk limited position instead.
- Lower position size based on gap risk (if your stock has a history of gapping 10%, take that into account).
- Hedge the position with options (buy an OTM option instead of using a stop loss).
- Diversify with several positions all a small portion of overall equity. More work but the best solution in most cases.
Implementing Kelly
Disclaimer: this article is intended to provide accounts of personal experience, and explain mathematical concepts, it IS NOT personalized trading, or investment advice. I am not registered with any regulatory body, and do NOT provide any form of advice, I purely invest my own money and share my experiences free of charge.
With the above discussion out of the way, I’m now going to cover implementation. I have personally developed risk calculators in both Python and Microsoft Excel, I find excel is generally simpler, but if you’re more comfortable with coding, you may prefer to do it that way.
In the interests of not encouraging people to blindly copy high risk strategies, I will explain the implementation rather than providing spreadsheets. If you are looking for a simple copy paste solution to make easy money, you should look elsewhere.

The first step is to calculate the risk to reward ratio, this is simply the distance from the entry to target divided by the distance from entry to stop loss (or expected fill) for longs, or the reverse for shorts. The next component to the formula is the probability of profit, a manually entered field, for now we’ll use a historical average winrate for your strategy.
Next the % risk is calculated with the base kelly formula I mentioned originally, to avoid negatives I added the excel max function (MAX(FORMULA,0.0000001). In our implementation that is probability (expressed fractionally) – (1/probability)/r ratio). The hard part of the job is now over, now all that’s needed is to calculate the actual position size.
Multiply the kelly risk by the kelly factor you’ve determined meets your risk appetite and then account balance/((entry-stop)/stop*100)/risk%. You can then add more columns if you’d like to calculate the $ value of the position, and the gain / loss but that is optional.
Conclusion
While there are no silver bullets, managing position sizing in a sensible manner is the easiest way to go from a profitable trader to an immensely profitable trader. Understanding expected risk, performance and drawdowns is absolutely essential to any aspiring trader.
Leave a Reply